| Current status | 2018 |  |
| Short term status | 2014 - 2018 | |
| Long term status | 2009 - 2018 | |
Click on the charts below in order to see the full resolution versions.
In 2012, the ‘First Report of the High-Level Panel on Global Assessment of Resources for Implementing the Strategic Plan for Biodiversity 2011-2020’, estimated that between US$150-440 billion per year would be required to deliver the Convention on Biological Diversity’s (CBD) global strategy for conserving biodiversity. The estimate of the actual global scale of funding for biodiversity and ecosystem services (in 2010) was US$51.5-53.4 billion: a financial shortfall or ‘conservation funding gap’ of between 64-88% (Parker et al. 2012).
In order to address the global funding gap, the Convention on Biological Diversity adopted a Resource Mobilisation Strategy in 2012 which included a number of key financial targets and actions by Parties to the Convention:
- The doubling for biodiversity-related financial resource flows to developing countries, maintained until at least 2020.
- The mobilisation of domestic resources from all sources to reduce the gap between identified needs and available resources at domestic level, for effectively implementing by 2020 Parties’ national biodiversity strategies and action plans.
- Reporting on domestic biodiversity expenditure, biodiversity funding needs, gaps and priorities by 2015 to improve the robustness of the baseline.
- Preparation of the national financial plans for biodiversity.
In response, the Dept. Culture, Heritage and the Gaeltacht and Irish Research Council co-funded a National Biodiversity Expenditure Review (NBER) to examine the level and pattern of expenditure relevant to biodiversity (Morrison & Bullock, 2018). The NBER recorded spending by government departments, agencies and non-governmental organisations 2010-2015, using the categories of expenditure provided by the Biodiversity Finance Initiative (BIOFIN). Over this six-year period:
- The average national expenditure on biodiversity was estimated to be €250 million p.a., 0.31% of total governmental expenditure and 0.13% of Gross Domestic Product (GDP).
- State-led institutions are responsible for channelling 96.6% of expenditure, compared to 1.2% by Local Authorities and 1.3% by non-governmental organisations.
- Agriculture is the dominant sector for biodiversity-related finance, accounting for 75% of expenditure.
- Although ca. 90% of our national territory consists of the marine environment, 1.3% of expenditure was on marine conservation compared to 8.4% on freshwater and 90.3% on terrestrial conservation.
In support of Aichi Target 2 of the CBD Strategic Plan for Biodiversity 2011-2020, the UN Statistical Commission adopted the System of Environmental Economic Accounting (SEEA) in 2012 as a framework that organises and presents statistics on the environment and its relationship with the economy. At a national level, the Central Statistics Office has advanced this framework, developing and publishing “Environmental Subsidies and Similar Transfers”, for the first time in 2017.
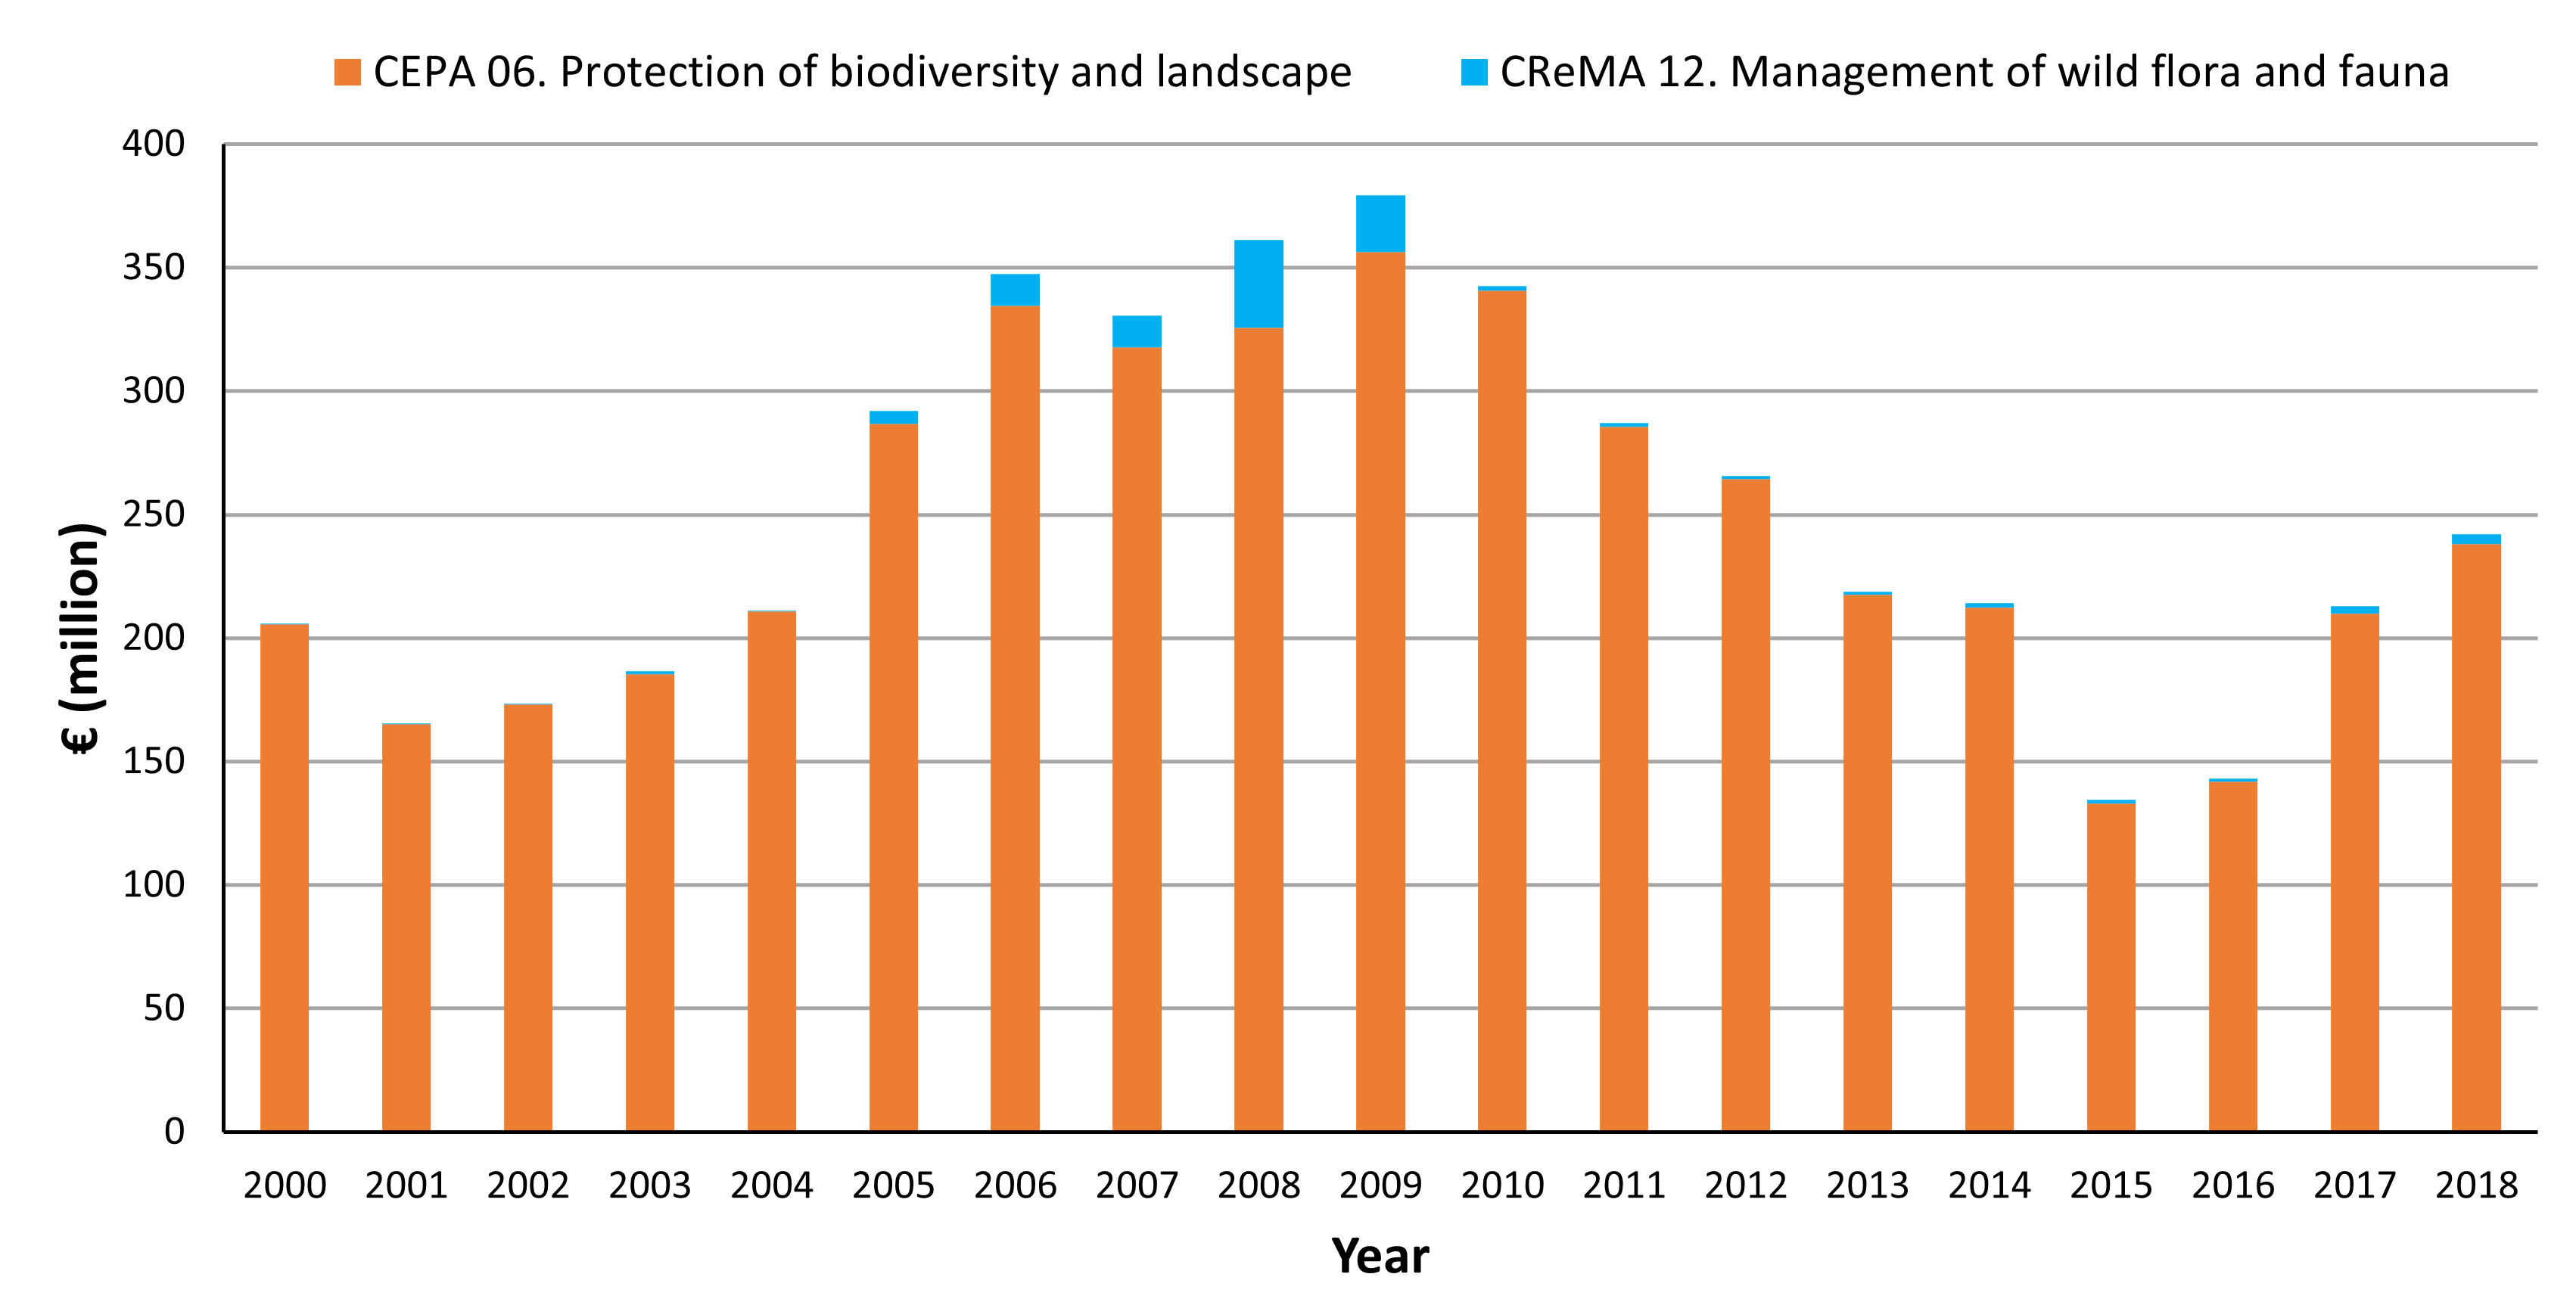
Environmental subsidies and similar transfers can be classified by the environmental protection or natural resource domain towards which they are targeted (for definitions of both activities and further details, the link is provided below). This indicator presents governmental expenditure under the Classification of Environmental Protection Activities (CEPA) 06 Protection of biodiversity and landscape (Table 2.6) and Classification of Resource Management Activities (CReMA) 12 Management of wild flora and fauna (Table 2.12) in the Environmental Subsidies and Similar Transfers module collated by the CSO.
The mean total transfers across CEPA 06 and CReMA 12 programmes from 2000-2018 was €242.3 million. In 2018, the total transfers for biodiversity protection and management were €241.7 million, 24% higher than the preceding five-year average and 1% higher than the 10-year average.
References
CBD High-Level Panel (2014). Resourcing the Aichi Biodiversity Targets: An Assessment of Benefits, Investments and Resource needs for Implementing the Strategic Plan for Biodiversity 2011-2020. Second Report of the High-Level Panel on Global Assessment of Resources for Implementing the Strategic Plan for Biodiversity 2011-2020. Montreal, Canada.
https://www.cbd.int/financial/hlp/doc/hlp-02-report-en.pdf
Central Statistics Office. Environmental Subsidies and Similar Transfers.
https://www.cso.ie/en/statistics/environmentaccounts/environmentalsubsidiesandsimilartransfers/
Morrison, R. & Bullock, C. (2018). A National Biodiversity Expenditure Review for Ireland, University College Dublin.
https://www.npws.ie/news/national-biodiversity-expenditure-review-ireland
Parker et al. (2012). The Little Biodiversity Finance Book. Global Canopy Programme, Oxford.
https://www.globalcanopy.org/publications/little-biodiversity-finance-book-3rd-edition-2012
Secretariat of the Convention on Biological Diversity (2012). Strategy for Resource Mobilization.
http://www.cbd.int/financial/doc/srm-guidance-2012-01-en.pdf
UN System of Environmental Economic Accounting.
National expenditure on biodiversity
Public sector expenditure is one way of assessing how the protection of biodiversity is prioritised by governmental departments and agencies. Together with appropriate policy and legislative measures, sufficient resources are required to effectively deliver on national and international biodiversity commitments.